The dashboard is the first screen you will see after logging in. This displays available data on both plants and packages within your organization. Each section can be shown or hidden by clicking the arrow in the right of the section header bar.
System health monitor
This section of the dashboard is intended as a warning system to alert of potential compliance issues.
API Key Health
The Outlaw System routinely tests the API key used to communicate with your compliance vendor (LeafLogix, Metrc, etc...). The results of this test will be displayed in this section. A bad API key will cause synchronization issues between the Outlaw system and the compliance system. If you are alerted that the key has gone bad please generate a new key and send it to support@outlawtechnology.net as quickly as you can.
Please note that the Outlaw staff also monitors all API key health throughout the workday and will reach out if a bad key is detected, but there is still a chance you will notice this before we do.
Overdue Reports
Certain data collected by the Outlaw family of systems is required to be submitted to the compliance vendor within a timely manor. If any of these reports have not been fully submitted after two days of being created, they will show up here. These reports are grouped into three categories: Harvest and Waste, Plant Move and Plant Destroy, Package Move and Package Adjust.
Reports must be fully submitted to not show up on these lists. If even one plant/package did not get submitted, the report will have a status of "error" instead of "submitted" and be listed as overdue. It is therefore recommend that any plant or package that can't be submitted (for whatever reason), be deleted from the report.
e.g. You create a Destroy Plant report with 20 plants. 19 of them submit just fine, but 1 had already been destroyed manually (not using the Outlaw system). Because the 1 didn't submit successfully, the whole report will be marked as 'error'. Deleting that 1 from the report will fix this issue, and all 20 have still been destroyed.
Another way to remove reports from these lists is by Archiving them. Regardless of if all items have been submitted or not, an "Archived" report will never show up here. This is useful for removing any test reports or reports with any extenuating circumstances. Click here to learn more about archiving.
A healthy system
will report a System Health of "All Good" with a green colored title bar. Whereas if any of the checks mentions above fail, the System Health will alert that there is "Action Required" and highlight the title bar red.
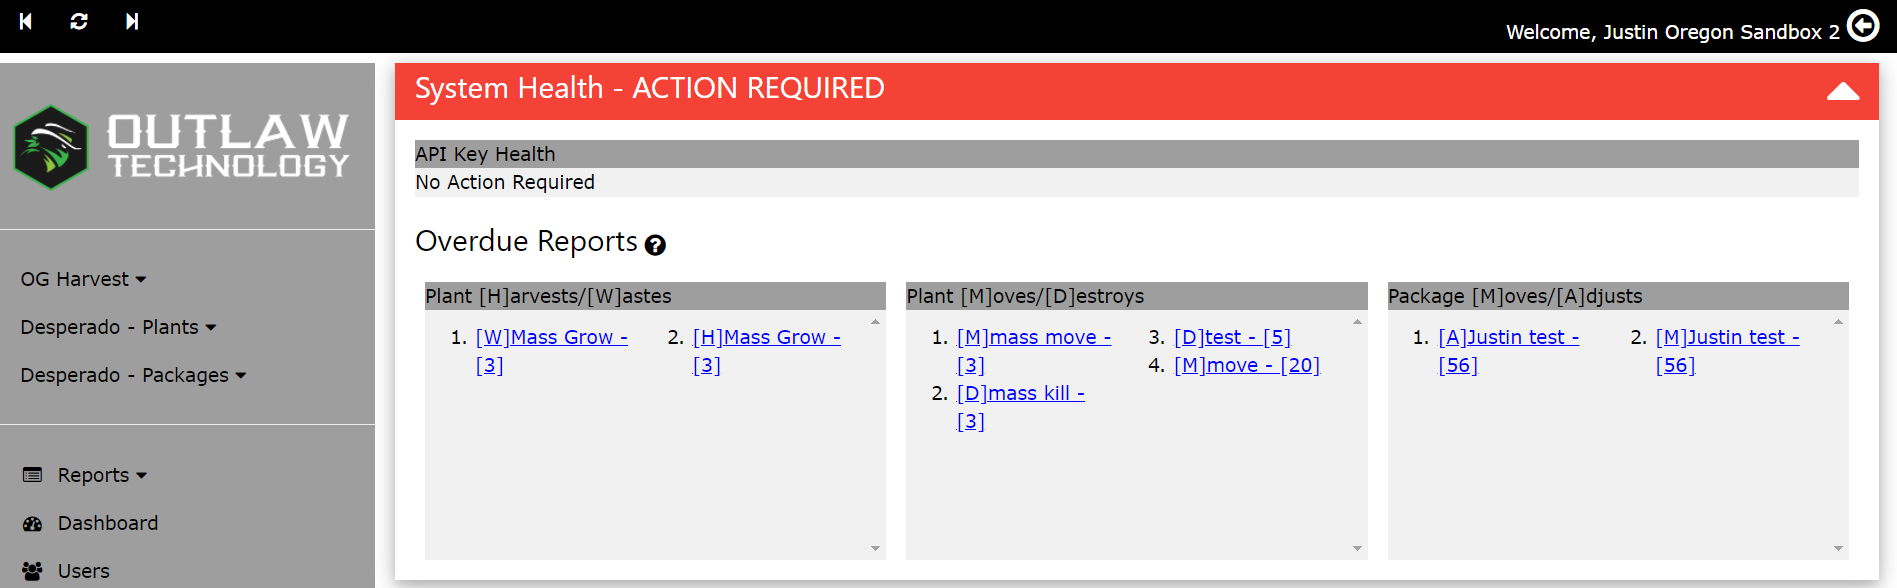
For Overdue Reports the first letter in brackets indicates which type of report it is, the last number in brackets shows how old, in days, the report is. Clicking on the report name will take you directly to that report's details.
Plant Info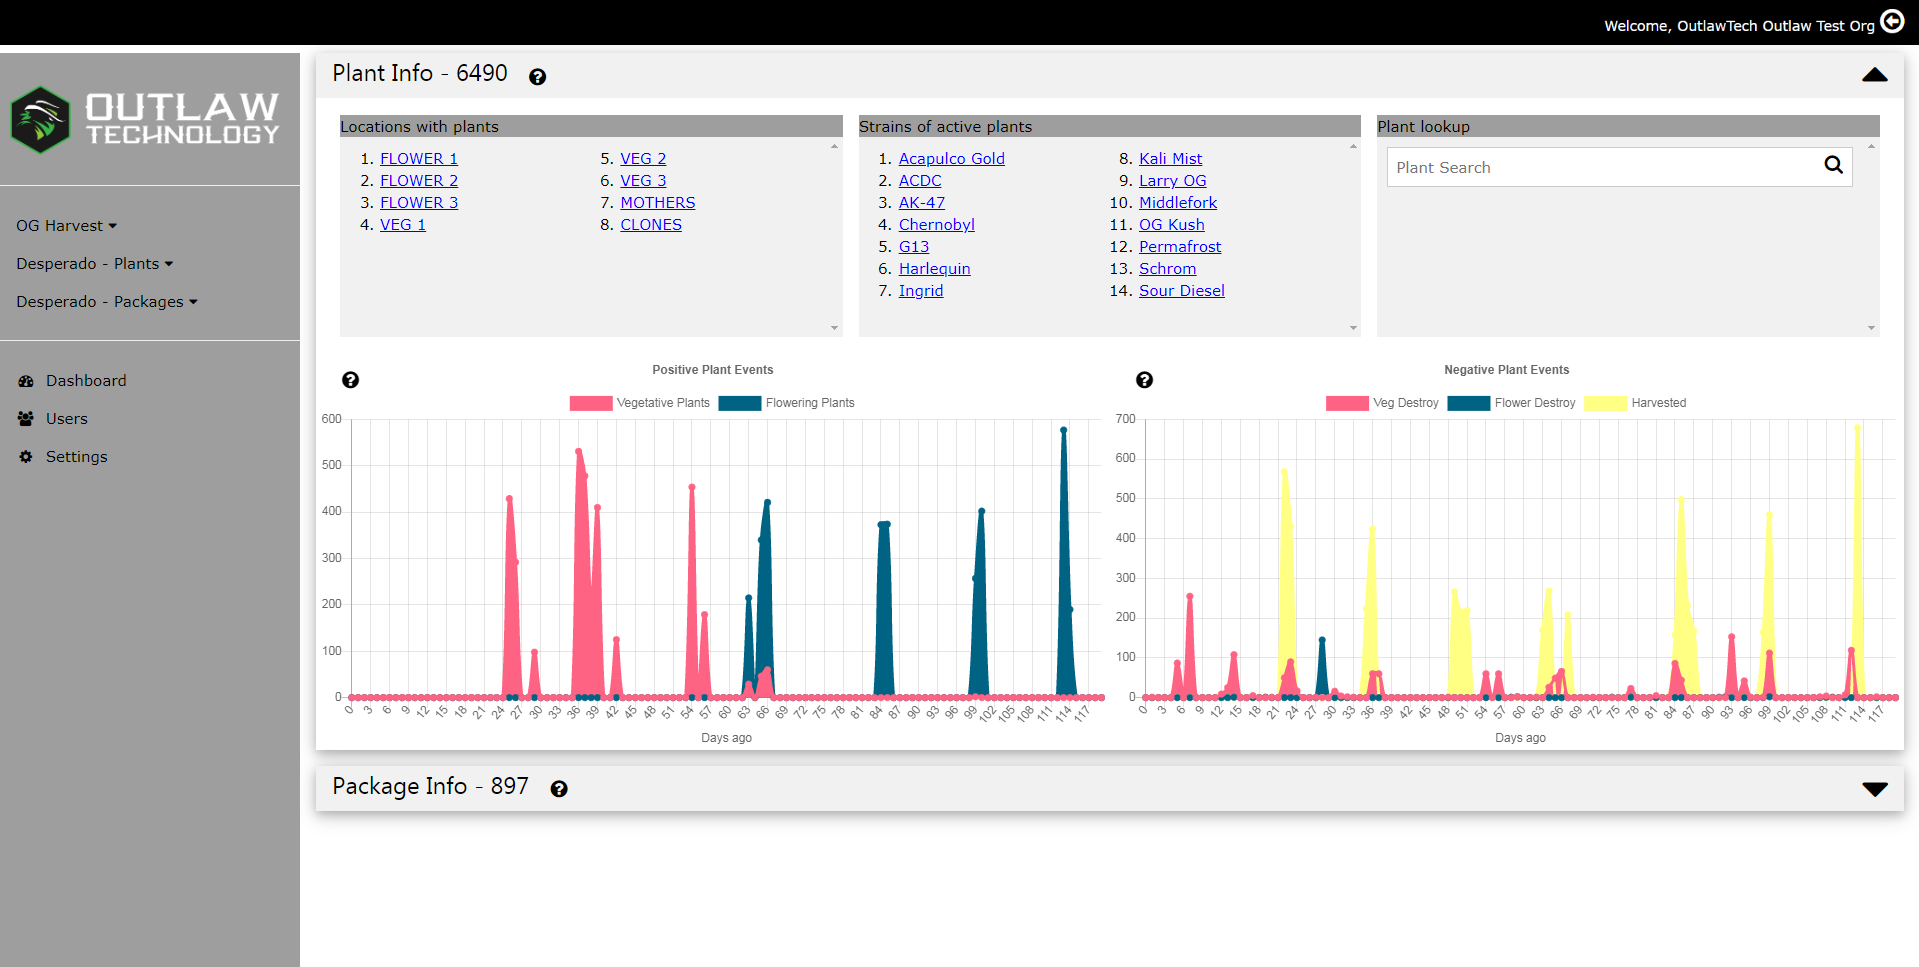
The number in the title bar (6490) is the count of active plants. Below the title bar is a row of three sections: Locations, Strains, and Plant lookup.
Locations & strains
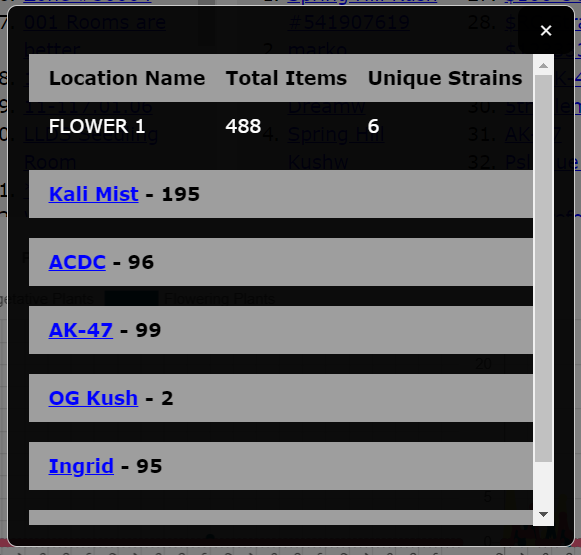
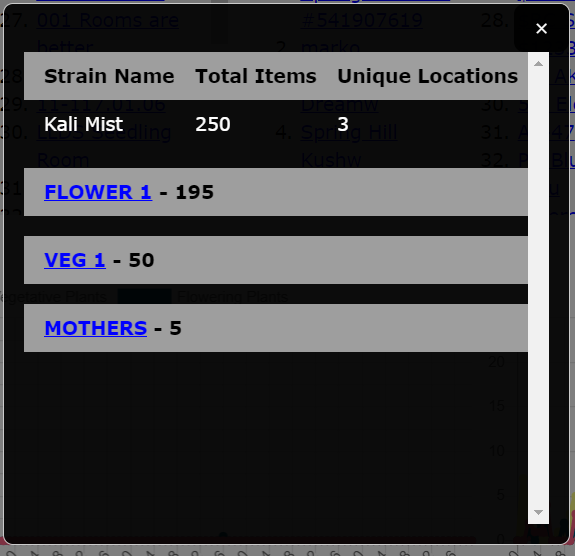
Clicking on either a location name or strain name will open a popup, as seen below:
 |
 |
|
Clicking a location name will open a popup showing all tags within that location. This list is divided by strain name. Clicking the grey bar for a particular strain will expand the section showing a list of tags. |
Clicking a strain name will open a popup showing all tags of a particular strain. This list is divided by location name. Clicking the grey bar for a particular location will expand the section showing a list of tags. |
Plant Lookup
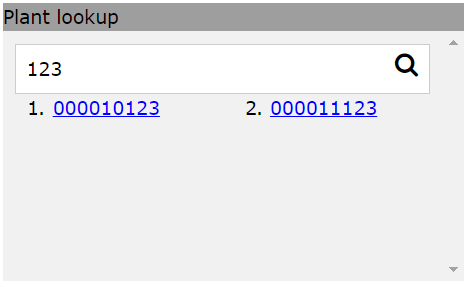 |
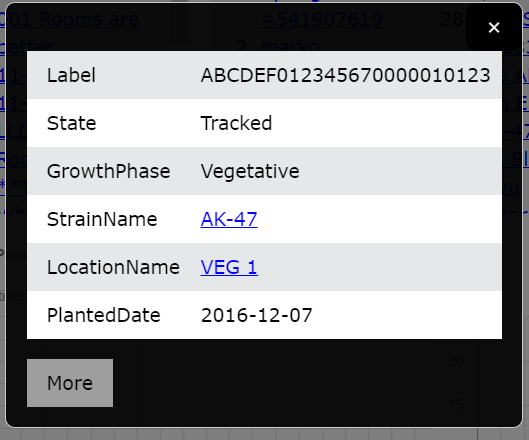 |
| In this section, a tag id suffix can be entered and all plants that match will be listed. | Clicking on any tag will open a popup displaying information on it. |
Charts
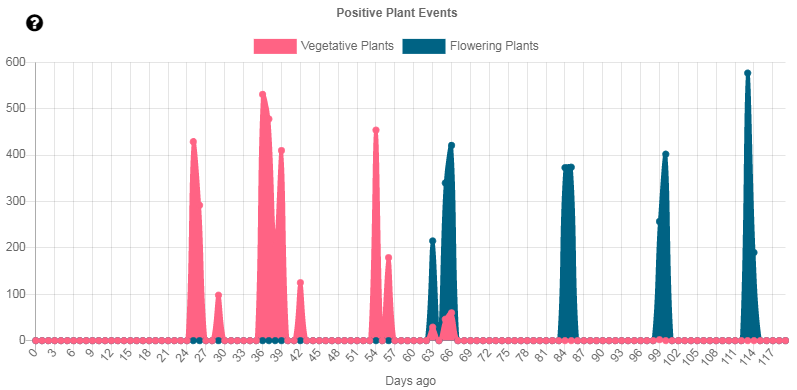
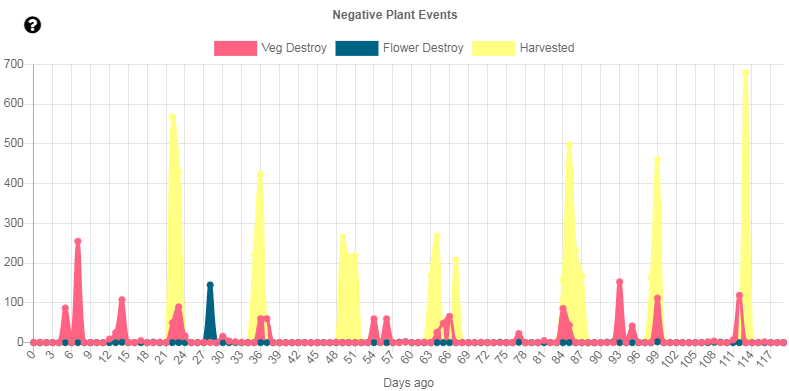
There are two charts displayed for plants. The one on the left shows Positive Plant Events (planting) and the right shows Negative Plant Events (harvests and destroys). The vertical axis represents number of plants, and the horizontals represents the number of days since the event. Day 0 (today) is to the far left of the chart and 120 days ago is to the far right.
Note: Clicking the colored rectangle above the chart will toggle the display of clicked data on or off.
| Positive Plant Events | Negative Plant Events |
 |
 |
|
The large leftmost peak shows that 26 days ago, 425 new plants were planted. The pink color means they are currently in the Vegetative stage. The large rightmost peak shows that 115 days ago, 580 new plants were planted. The blue color means they are currently in the Flowering stage. |
The large peak to the left of the chart shows that 8 days ago, 280 plants were destroyed. The pink color means they were in the Vegetative stage. The leftmost yellow peak shows that 23 days ago, 575 plants were harvested. The blue peak (around 28 days ago), shows 150 plants were destroyed while in the Flowering stage. |
Package Info
Please read the above section on Plant Info as these two sections are very similar and this section only covers the differences specific to package info.
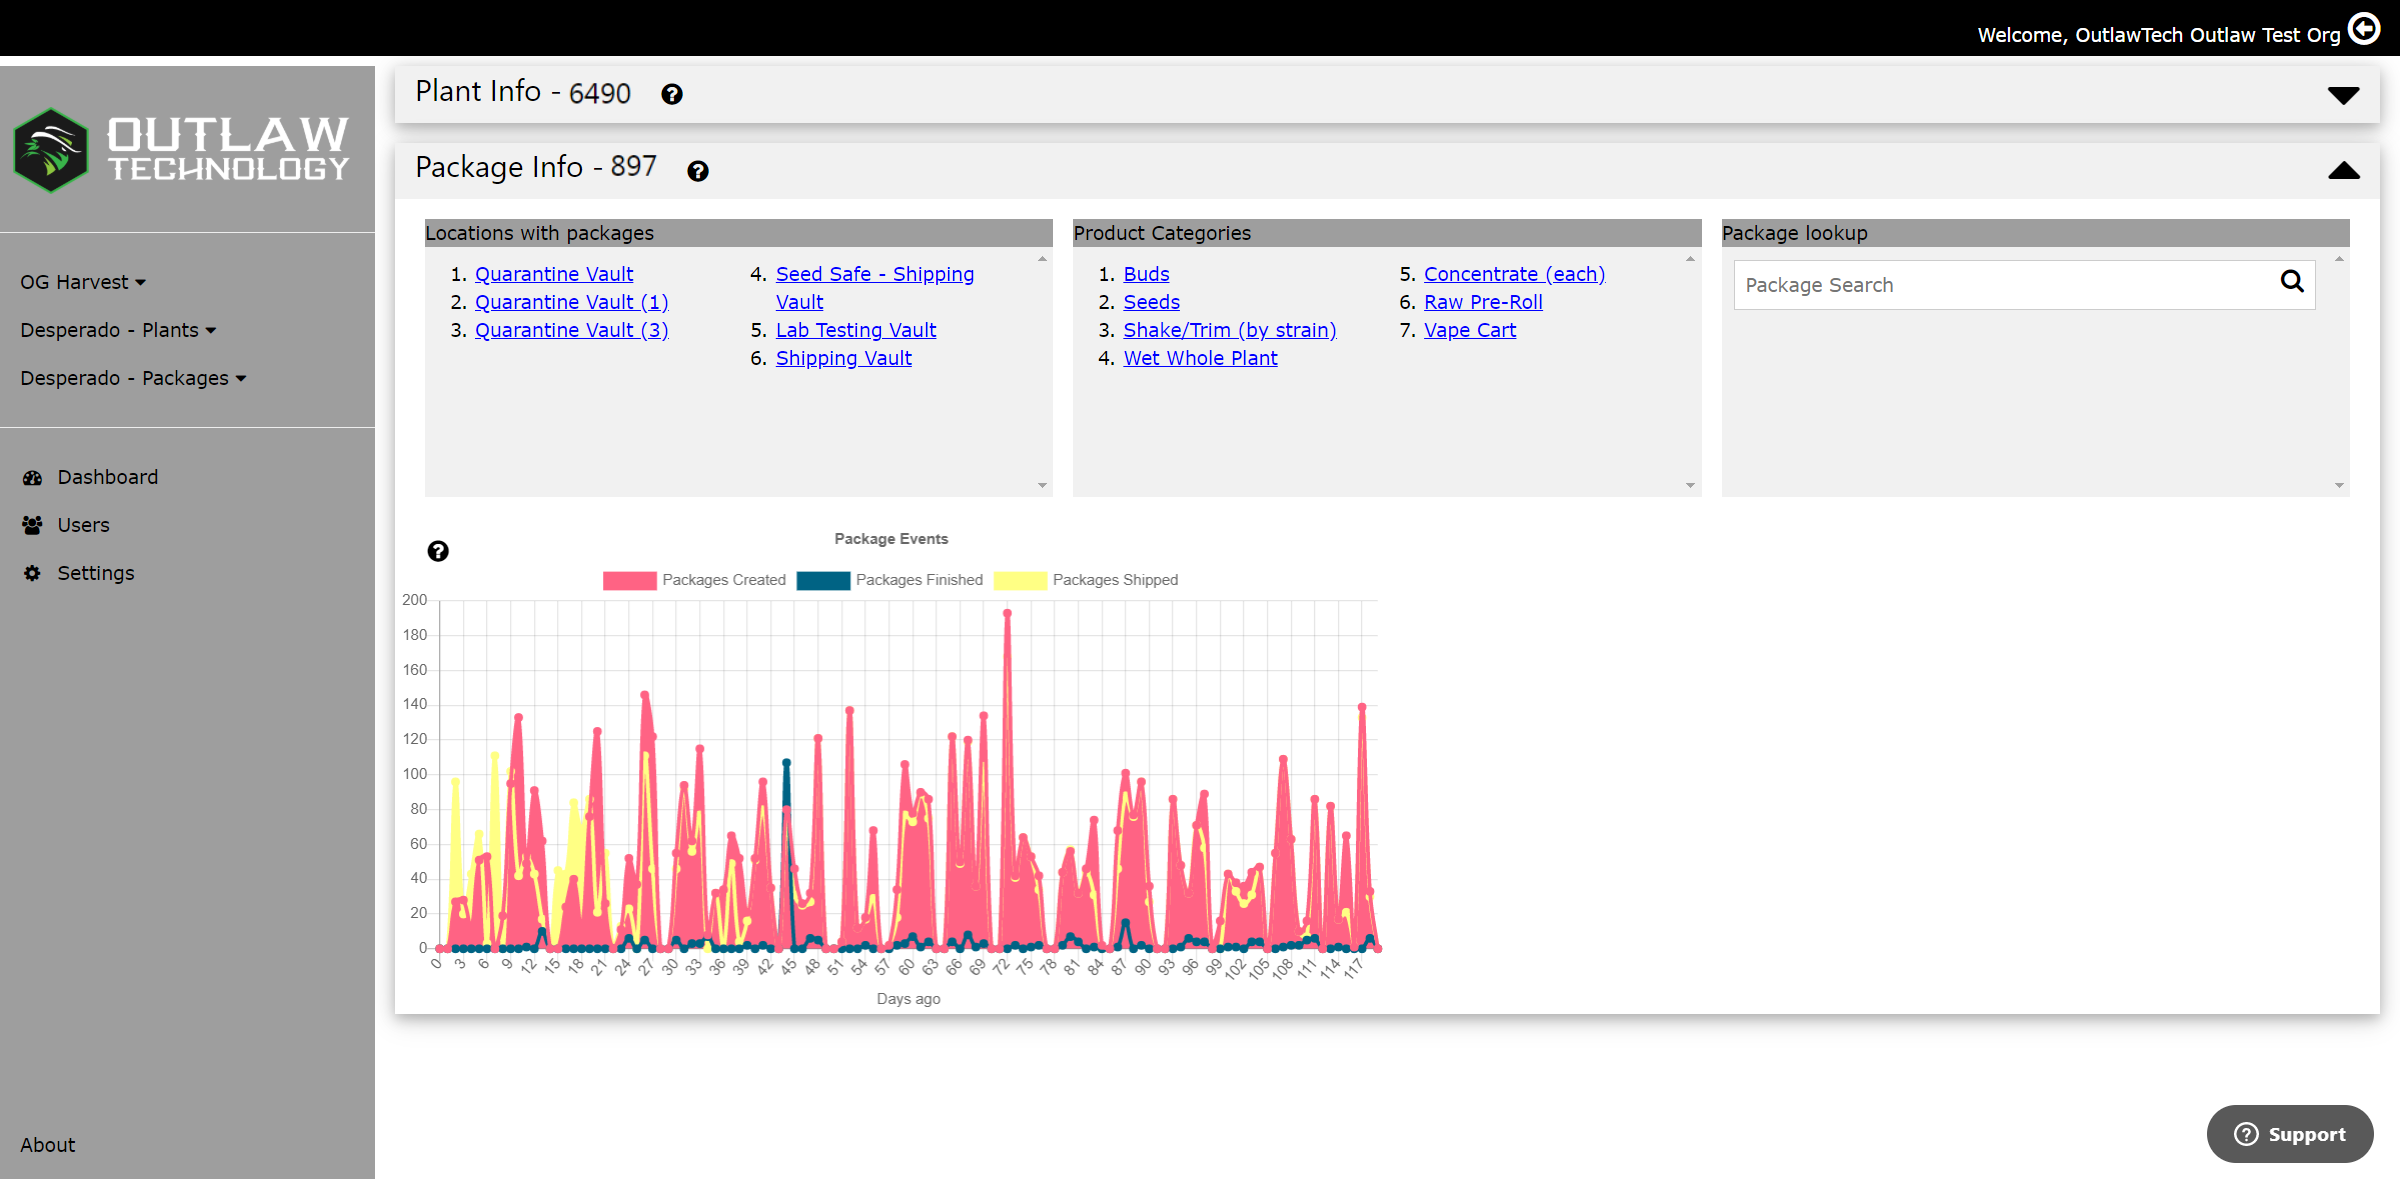
Product Categories
Instead of strains, packages are separated by Product Categories. Clicking on a name will open a popup containing a list of packages of that category.
Chart
Note: Clicking the colored rectangle above the chart will toggle the display of clicked data on or off.
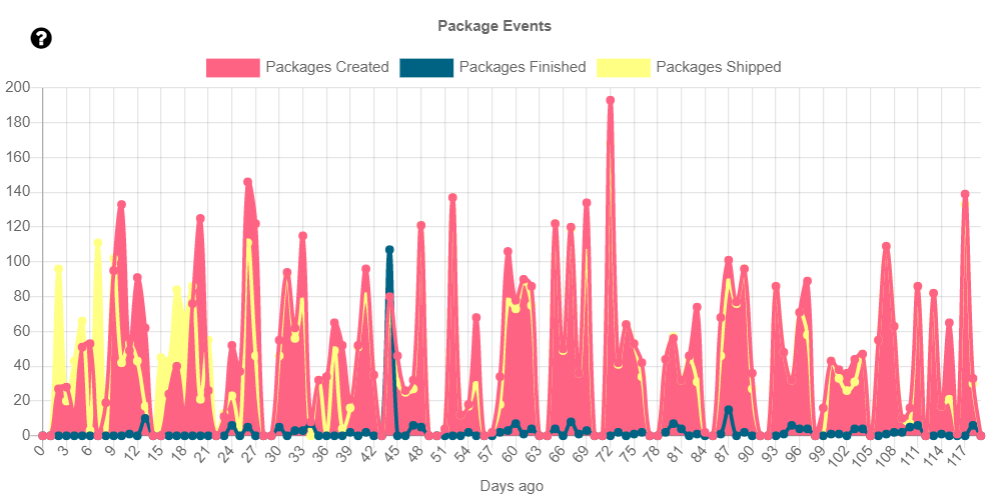
The package section only contains one chart that shows both positive and negative package events: Creation, Finishing, and Shipping. It is read in the same manner as the plant charts, with "Today" being to the far left and "120" days ago to the far right.
Comments
0 comments
Please sign in to leave a comment.